Chapter 4: Tracking Down and Handling Problems
One of the factors that most affects how quickly you can develop an application is your ability to track down and fix problems. Pylons provides three sets of tools to help you in this regard:
- A world-class web-based interactive debugger
- A console-based interactive testing shell
- A powerful set of logging tools
You’ll learn about the interactive debugger in this chapter, but I’ll leave the discussion of the interactive shell until Chapter 12 and the discussion of logging until Chapter 20.
You’ll also learn about how to present a page to the user when an error occurs using Pylons’ error documents support.
It is also worth remembering that the --reload option from the Paste HTTP server described in the previous chapter can also help speed up the debugging process. When the --reload option is used, the server keeps track of all the Python files your application uses, and if any of them should change, the server gets automatically restarted so that you can test your changes straightaway.
Using the Pylons Interactive Debugger
When you create a new Pylons application and keep the full_stack config option set to its default value of true, Pylons will include a special component called the ErrorHandler middleware in your application. You’ll learn more about how the ErrorHandler middleware actually works in Chapter 17, but you don’t need to know the details of how the ErrorHandler middleware works in order to use the Pylons interactive debugger.
If an exception occurs when debug mode is set to true in the config file, the ErrorHandler middleware catches the exception and triggers the Pylons interactive debugger, which is a web page that provides various means of debugging the application, including an interactive Ajax-based Python console (see Figure 4-1).
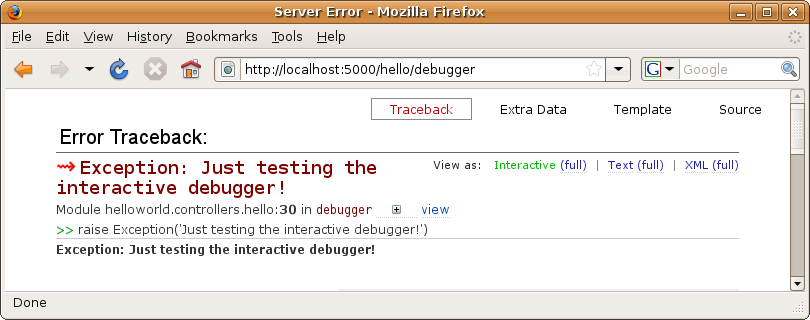
Figure 4-1. The Pylons interactive debugger
The interactive debugger screen has four main tabs, three of which are particularly useful:
- Traceback tab
- This tab provides the raw exception trace and allows you to see the local variables at each part in the traceback. If you click >>, you will be able to see the source code around the area where the code was called. Clicking + next to a particular part of the traceback will open an interactive Ajax Python prompt, which allows you to enter Python commands to debug the application at that point in the call stack. It also provides a view of all the local variables at that point in the stack. You can, of course, open many interactive Ajax Python prompts at different parts of the traceback to debug different parts of the call stack.
- Extra Data tab
- This tab displays the CGI environment and WSGI variables at the time of the exception as well as information about the global and application-level configuration options that are set in your development.ini config file.
- Template tab
- If the exception occurred while rendering a Mako template, this tab will be displayed by default and will contain Mako’s HTML representation of what went wrong. This can often be a lot more useful than the main traceback information because the syntax error that occurred can be displayed visually, enabling you to go straight to the template code to correct the error. If the exception that triggered the interactive debugger was not triggered in a template, the Template tab will be empty.
Let’s modify the HelloWorld application created in the previous chapter to re-create the exception shown in Figure 4-1. Add another action to the HelloController:
def debugger(self):
    value = "Some value"
    raise Exception('Just testing the interactive debugger!')
If you visit http://localhost:5000/hello/debugger, an exception will occur, and this will trigger the interactive debugger.
Try clicking the >> link by the words raise Exception, and you will see a representation of the code near where the error occurred. If you click the + icon after the word debugger on the previous line, you will be shown the local variables list and the interactive Ajax Python prompt. Try entering the following line:
print value
You should see the value Some value displayed, just like you would in a normal Python prompt (see Figure 4-2). Try entering some other Python commands, and you will see the prompt behaves exactly as a normal prompt. You can even use the up and down arrow keys to scroll through the command history.
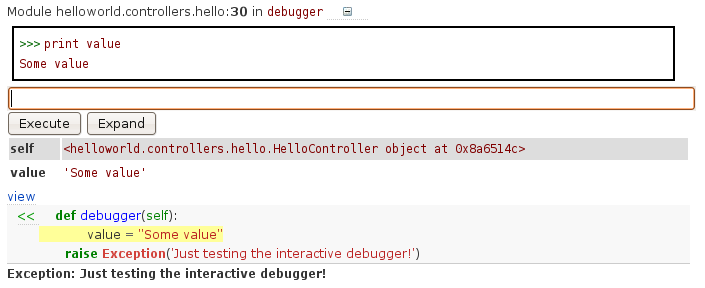
Figure 4-2. The interactive debugger in use
A new feature of the interactive debugger in Pylons 0.9.7 is the Online Assistance box shown in Figure 4-3. Clicking Search Mail Lists will present a search box with the exception prepopulated to allow you to search the Pylons mailing list for the error that occurred. You can also search related mailing lists such as the Python, Mako, and SQLAlchemy lists.
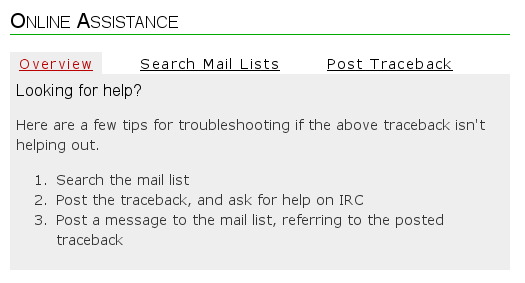
Figure 4-3. The online assistance tools
If you can’t find a discussion of the error that has occurred, you can post the complete traceback online. You can then send an e-mail to the mailing list referencing your traceback post or talk to other Pylons users directly in the IRC channel.
Caution
When posting traceback information online, be sure to check that you don’t post any private information such as usernames and passwords. All the information you post is publically accessible.
Occasionally it is even handy to deliberately put an exception into your code like this during development to act a bit like a breakpoint and allow you to see what is happening at that point in the code.
You can even use the interactive debugger to debug Ajax requests. Every time an error occurs, the interactive debugger will log an error message containing a URL at which the error traceback can be accessed. You simply need to visit that URL in a web browser to be able to interactively debug that particular request. Each request that results in an error is given a slightly different URL so that you can be sure you are debugging the correct request.
In addition to printing the debug URL to the error log, an HTTP header named X-Debug-URL containing the debug URL will also be added to the HTTP response headers, so you can read the URL from there too. In Figure 4-4, you can see that the exception just raised will also be available to debug at http://localhost:5000/_debug/view/1217245745. The number at the end of the URL will be different on each request, though.
Since the interactive debugger is accessed at the URL /_debug, it is important that you don’t design any URLs into your application to start with /_debug, or the interactive debugger is likely to interfere with them.
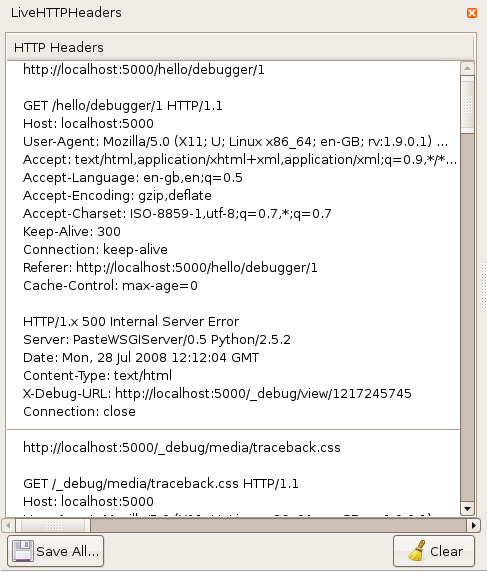
Figure 4-4. The HTTP response including an X-Debug-URL header
Production Use
If you haven’t realized it already, leaving the interactive debugger enabled in production environments represents a major security risk because in the same way that you can enter any Python command you like in order to track down a potential problem when an exception occurs, a malicious visitor to your web site could use the same tool to enter malicious Python commands to do damage to your system or, worse, to use your system to launch attacks on other people’s systems.
For this reason, it is important you disable the interactive debugger when running a Pylons application in any environment where a page containing the interactive debugger might be shown to someone other than yourself if an error occurs.
To disable debugging, uncomment the following line in the [app:main] section of your development.ini file:
#set debug = false
so that it reads as follows:
set debug = false
You have been warned!
Caution
Do not leave the interactive debugger enabled on production systems.
E-mail Options
Once you have disabled the interactive debugger for production use, you will be able to set up your application to send error reports to your e-mail address should an exception occur. The error reports will contain the full traceback as well as the information that would normally appear on the Extra Data tab.
To enable Pylons’ error reporting, you need to ensure you have disabled interactive debugging as described earlier, but you also need to set your e-mail address in the email_to variable in the [DEFAULT] section at the top of the config file. The e-mail will be sent via SMTP, so you must also specify an SMTP server you have access to and choose an e-mail address that the e-mail should appear to come from:
[DEFAULT]
debug = true
# Uncomment and replace with the address which should receive any error reports
email_to = feedback@pylonsbook.com
smtp_server = smtp.pylonsbook.com
error_email_from = server.error@pylonsbook.com
The error reports look something like Figure 4-5 and will help you identify the problem that caused the exception.
If an error report is sent, a 500 Internal Server Error response is displayed using Pylons error documents support. You’ll learn how to customize error documents in Chapter 19, when you put the finishing touches on SimpleSite, the example application you will develop throughout the book.
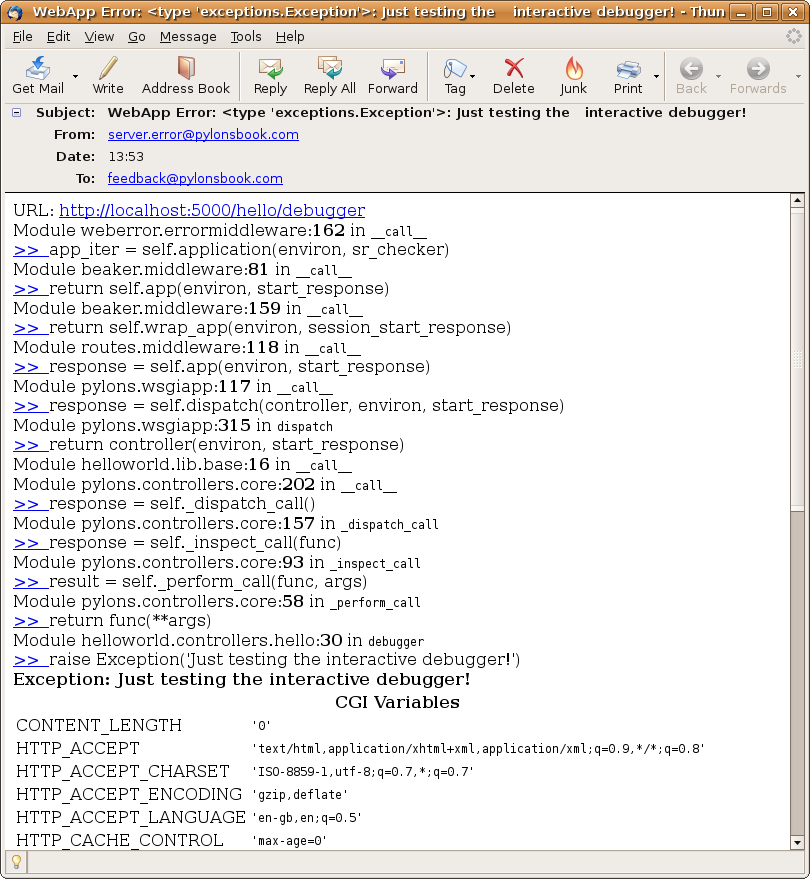
Figure 4-5. An e-mail error report
Summary
Now that you know how to use the interactive debugger, you can move on and start looking at individual topics involved in Pylons development. If you are following along with the examples in the book, feel free to explore the traceback any time an exception occurs. The interactive debugger is a very useful tool that will help you track down problems quickly as well as give you better insight into what is going on beneath the surface of your Pylons application.